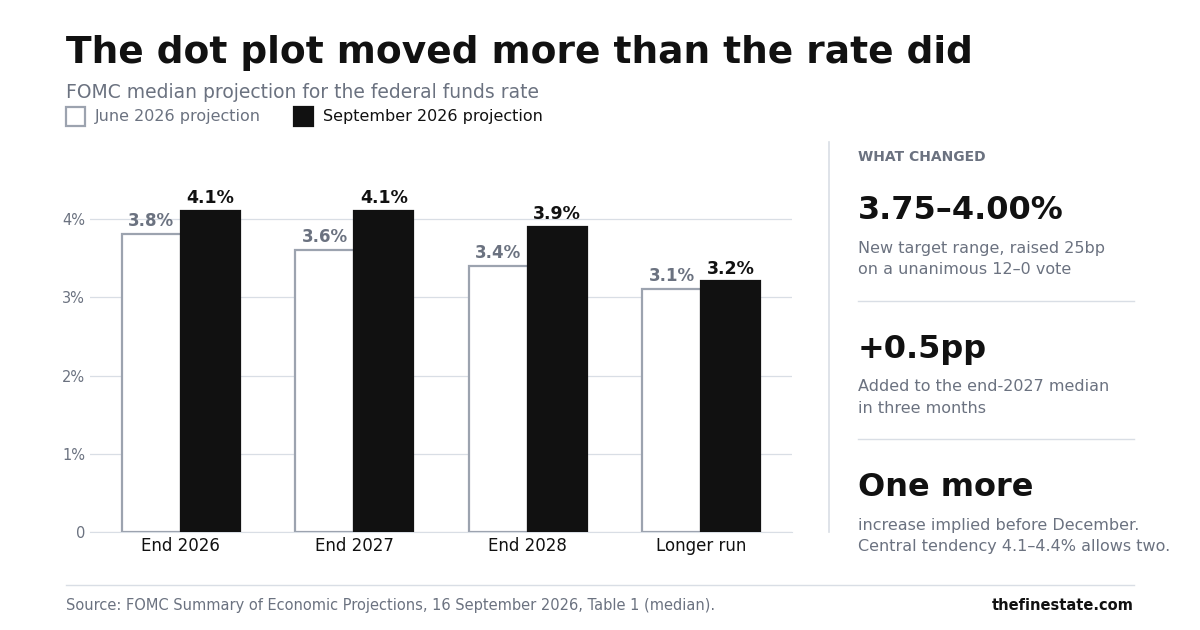
The Fed raised its benchmark rate 25 basis points to 3.75–4.0% on 16 September 2026, on a unanimous 12–0 vote. The projections published alongside it put the median rate at 4.1% by the end of the year — one further increase, with the central tendency allowing for two. Your home loan EMI does not change today. Brent crude near $108 and a rupee around 96 are already inside your grocery bill.
The decision and the Summary of Economic Projections published together at 2:00 PM ET (11:30 PM IST). The sections below answer what this does to an Indian salaried reader’s money this month — the home loan, the portfolio, the rupee and foreign stock compensation — plus what the projections signal for the rest of the year, and the data tension the Committee was navigating.
This applies to you if
- You have a floating-rate home loan linked to your bank’s EBLR, and want to know what the Fed meeting actually changes about your EMI.
- You hold Indian equity mutual funds or listed shares and are watching FII outflows.
- You pay education fees, rent, or recurring bills in US dollars, or plan to travel internationally.
- You receive RSUs or ESOPs from a US-listed employer.
Your home loan: the EMI does not move today
Indian floating-rate home loans are priced off the RBI repo rate through the EBLR. The Fed’s rate has no formal role in this chain. Your EMI does not change on 16 September. What changes is one factor in the path toward a cheaper loan.
Every floating-rate home loan originated after October 2019 is linked to an External Benchmark Lending Rate. For most borrowers, that benchmark is the RBI repo rate. Your bank adds a fixed spread to the repo rate, and the result is your loan rate. When the RBI moves its repo rate, banks must reset EBLR within one quarter. If your loan is still on the older MCLR benchmark, the reset is slower and the switch is a separate decision — we covered when an MCLR-to-EBLR switch is worth the conversion fee in detail. SBI home loan rates were quoted between 7.25% and 8.45% in September 2026, depending on credit score and loan amount.
Where the Fed matters is two intermediate steps back. US monetary policy affects global capital flows and the US dollar. Capital drawn toward higher US yields tends to leave emerging market currencies, including the rupee, under pressure. A weaker rupee raises imported inflation — energy, electronics, raw materials priced in dollars — which in turn constrains the RBI’s room to cut its own repo rate without worsening the currency problem. If the RBI has less room to cut, the path to a lower EBLR lengthens.
A rate increase tightens this chain. The US–India rate differential narrows when the Fed hikes and the RBI holds. Rupee pressure increases, imported inflation rises, and the argument against a domestic rate cut strengthens. That is the mechanism. Whether it reaches the repo rate, and when, is the RBI’s decision and no one else’s — the committee has held through several meetings where the same argument was available to it.
The next RBI Monetary Policy Committee meeting is 5–6 October 2026, with the rate decision announced on 7 October. Watch the MPC statement for three things: how the committee characterises the crude-driven inflation trajectory, whether the stance shifts from “neutral,” and any signal on the path beyond October.
What the RBI does on 7 October
One email when the MPC decides, and what it means for your EMI.
No daily digest, no tips.
The data the Fed was navigating
The August US inflation report presented the Fed with a genuine tension, and the article would be incomplete without saying so plainly. Core CPI — which strips out food and energy — came in at 2.4% annual in August 2026, the lowest reading since March 2021. Headline CPI was 3.4%. Gasoline rose 3.9% in August and accounted for over a third of the monthly all-items increase on its own; the energy index is up 16.3% over twelve months. These two numbers point in different directions.
The case for a hold rests on core. Central banks typically look through supply-driven energy shocks and act on the inflation that monetary policy can actually reach. Core at 2.4% is close to the Fed’s 2% target. A central bank running on that number alone would have room to ease — or at minimum, no strong reason to tighten further. Core monthly was +0.3%, after +0.2% in July.
The case for a hike rests on the energy trajectory. Brent crude closed at $102.81 on 15 September and traded around $107.77 on 16 September — roughly a 5% move in a single session, on top of a 21.66% rise over the preceding month. The driver is a Saudi pipeline shutdown following drone attacks: loadings at Yanbu remain suspended with no published timeline for resumption. Supply-driven shocks are normally transitory, but this one is geopolitical rather than weather-related and the timeline is unclear. Energy at this level feeds into core with a lag — through transport costs, then input costs, then manufactured goods prices. The argument is that waiting for the lagged pass-through to appear in core data means the Fed responds too late.
CME FedWatch put the probability of a hike at 84.1% on 14 September. Goldman Sachs and JPMorgan were aligned near 87%. Markets were not treating this as close.
The Committee resolved the tension in its own projections, and the resolution is explicit. Core CPI is running at 2.4% today. The Committee projects core PCE inflation at 3.4% for 2026 as a whole, up from 3.3% in June. Those are different indices measured over different windows, so they are not directly comparable — but a central bank forecasting core inflation well above where core is currently printing is a central bank that expects the energy shock to pass through rather than fade. That is the argument for moving now, stated in numbers rather than in the statement.
Editor’s Analysis
With crude moving this fast, relief on rates would be the wrong call.
What the dot plot actually said
The Committee moved its entire projected rate path up, and by more than the single 25bp increase suggests. The median projection for the federal funds rate at the end of 2026 is 4.1%. The new target range midpoint is 3.875%. With two meetings left this year, that gap is the signal.
The Summary of Economic Projections is published four times a year and September is one of them. Each participant marks where they expect the federal funds rate to sit at each year-end. Comparing September against June shows the direction of travel.
| Median federal funds rate | June 2026 projection | September 2026 projection |
|---|---|---|
| End 2026 | 3.8% | 4.1% |
| End 2027 | 3.6% | 4.1% |
| End 2028 | 3.4% | 3.9% |
| Longer run | 3.1% | 3.2% |
A 4.1% median against a 3.875% midpoint is one further 25bp increase. The central tendency for end-2026 is 4.1–4.4%, which spans one to two more increases across the two remaining meetings. The full range runs 3.9–4.4%, so at least one participant expects no further move — the unanimity on today’s decision does not extend to the path.
The 2027 median moved half a percentage point higher in three months. That is a larger revision than today’s rate change, and it is the part of the release that matters for capital flows into and out of India over the next year.
The rest of the projections explain the shift. The Committee marked the unemployment rate down to 4.1% for 2026 from 4.3% in June, marked GDP growth up to 2.3% from 2.2%, and marked PCE inflation up to 3.7% from 3.6%. Stronger labour market, stronger growth, higher inflation than they expected three months ago. The remaining 2026 meetings are 27–28 October and 8–9 December.
FOMC September 2026 India impact: $108 crude and your grocery bill
India imports the large majority of its crude oil. A sustained price move of this scale does not stay in a Bloomberg terminal — it moves through fuel prices, transport costs, and eventually the grocery bill. The August inflation data released on 14 September shows it is already moving.
India’s CPI for August 2026 came in at 4.82% headline, with the food component at 5.95%. Rural inflation ran at 5.23% against urban inflation of 4.31% — the divergence reflects how energy costs and transport-linked food costs weigh more heavily in rural consumption baskets. Source: MoSPI provisional release, PIB, 14 September 2026.
Wholesale prices tell the input-cost side of the story. India WPI for August 2026 came in at 9.92% YoY, up from 9.78% in July. The Fuel and Power component ran at 22.93%. This is the cost pressure moving through the supply chain before it reaches the consumer. What shows up in CPI with a lag is already visible at wholesale. Source: Office of the Economic Adviser, provisional WPI release, 14 September 2026.
The transmission from Brent near $108 to a household budget runs through three channels. First, retail fuel prices: petrol and diesel prices in India are revised periodically by oil marketing companies on the basis of the 15-day average international benchmark and the rupee rate. The rupee near 96 amplifies the rupee cost of every barrel beyond the dollar price rise. Second, transport and logistics: freight costs on road and rail rise with diesel, feeding into the price of everything that moves, which is most food. Third, petrochemicals and plastics: packaging, construction inputs, and agricultural inputs such as fertilisers are all crude-derived and priced accordingly.
For the RBI, this is the constraint. The MPC has a 4% CPI mandate with a ±2% tolerance band. At 4.82% with food at 5.95% and crude near $108, the room to cut rates without the headline number threatening the top of the band is narrow. This is the domestic version of the same tension the Fed is navigating — energy-driven inflation against a core picture that might otherwise support easing.
Your equity portfolio and FII flows
Foreign investors pulled Rs 13,138 crore from Indian equities in the first eleven days of September. They were net buyers in July and August — Rs 20,200 crore and Rs 29,631 crore respectively. This is a reversal, not a trend, and that distinction matters more than the headline number.
When US yields are high or rising, risk-adjusted returns on US fixed income compete more effectively with the expected return on emerging market equities. Allocations shift. Indian equities bear a share of the selling. High crude compounds this: wider current account deficit, more rupee pressure, weaker macro optics for India. Both drivers are active in September 2026.
Cumulative FPI selling in Indian equities reached Rs 2.37 lakh crore in 2026 to 11 September, against Rs 1.66 lakh crore for the whole of 2025. But the July and August buying is the part most coverage omits: the same investors put Rs 49,831 crore in across those two months before taking Rs 13,138 crore out in September. Reported commentary attributes the September reversal to global macro conditions — crude and US yields — rather than to any change in the India view.
For a domestic retail investor holding equity mutual funds, FII activity shows up in index and NAV movements rather than directly in your account. Your SIP continues regardless. The FII outflow data is context — it explains where the market pressure is coming from, not what to do about it. How these macro signals connect to each other is set out in our RBI and macro guide for salaried readers.
The rupee and what it actually costs you
USD/INR was 95.95 on 16 September 2026 — within a rupee of the record low of Rs 96.90 hit in May. At this level, the practical costs of specific household expenses are measurably higher than at the 2024 rate of Rs 83–84.
Foreign education. Annual tuition and living costs in USD translate directly at the reference rate. A bill of USD 40,000 that cost approximately Rs 33.2 lakh at Rs 83 now costs approximately Rs 38.4 lakh at Rs 95.95. That is Rs 5.2 lakh more for the same year of education, before inflation at the destination.
Overseas travel and online subscriptions. Hotel and flight costs convert at the prevailing rate. Software, cloud tools, and streaming platforms priced in USD are charged monthly at the applicable card rate, which tracks close to the reference rate. Any USD-priced recurring cost has risen roughly 16% since 2024 without any change in the dollar price.
Imported goods. Crude-derived products — from petrol to plastics to fertilisers — carry both the international price increase and the rupee-rate premium. The WPI fuel component at 22.93% is the wholesale signal; the consumer price effect follows with a lag.
Foreign RSUs: vesting value and Schedule FA
If you receive US-listed stock compensation — RSUs, ESOPs, or FAST-DS instruments — a rupee move affects your vesting value and your tax reporting figure separately.
Vesting value. RSUs vest at the prevailing USD stock price, converted to INR at the exchange rate on the vesting date. At 95.95, a USD 100 RSU vesting today is worth Rs 9,595. At Rs 83, the same RSU was worth Rs 8,300. The INR gain is real income and taxable at slab rates in the year of vesting.
Schedule FA reporting. The conversion rate for Schedule FA is not the RBI reference rate — it is the State Bank of India telegraphic transfer buying rate (SBI TTBR), and different figures in the schedule use different dates. Acquisition value converts at the TTBR on the date you acquired the holding; peak value at the TTBR on the date the holding peaked; closing balance at the TTBR on 31 December, the close of the reporting period. A weaker rupee inflates the INR value of everything disclosed. That does not create additional tax on its own, but it is the figure the department sees when it processes your return.
For the full RSU tax treatment and ESOP mechanics, see ESOP and RSU tax: both taxable events, and Schedule FA. If you paid perquisite tax through payroll but never filed Schedule FA at all, the disclosure route and the deadline are covered in foreign RSUs you paid tax on but never disclosed.
Key Takeaways
- The Fed raised its benchmark rate 25bps to 3.75–4.0% on 16 September 2026 on a unanimous 12–0 vote. Your home loan EMI does not change today — EBLR transmission runs through the RBI repo rate, not the US federal funds rate.
- The dot plot matters more than the decision. The median projection for end-2026 is 4.1% against a target midpoint of 3.875% — one further increase — with a central tendency of 4.1–4.4% spanning one to two, across the two remaining meetings on 27–28 October and 8–9 December. The end-2027 median rose from 3.6% in June to 4.1%.
- The Fed was navigating a genuine data tension: US core CPI at 2.4% (a five-year low) points toward easing; Brent crude up 21.66% over the preceding month, and around $108 on 16 September, points toward the risk of lagged pass-through into core. The article presents both readings; the EA takes a position.
- India CPI was 4.82% in August 2026, with food at 5.95%. WPI was 9.92%, with fuel and power at 22.93%. These were released on 14 September and predate any pass-through from crude’s September surge. The next RBI MPC meeting is 7 October 2026.
- FII equity outflows hit Rs 13,138 crore in September’s first eleven days, against net buying of Rs 20,200 crore in July and Rs 29,631 crore in August. Cumulative 2026 selling is Rs 2.37 lakh crore, against Rs 1.66 lakh crore for all of 2025. The September move is a reversal driven by crude and US yields, not a re-rating of India.
- The rupee at 95.95 (16 Sep 2026) means foreign education, international travel, and dollar-priced subscriptions cost roughly 16% more in rupees than at the 2024 rate. That cost increase is separate from today’s Fed decision.
- If you hold US RSUs, Schedule FA converts at the SBI telegraphic transfer buying rate, not the RBI reference rate — acquisition value at the acquisition-date rate, peak value at the peak-date rate, closing balance at the 31 December rate. Cross-check your broker’s year-end statement against those rates when you file for AY 2027-28.
Frequently Asked Questions
Does a Fed rate change affect my Indian home loan EMI?
Not directly. Indian floating-rate home loans are linked to the EBLR, which tracks the RBI repo rate. The RBI sets its repo rate on domestic inflation and growth conditions. The Fed affects your home loan indirectly through two intermediate steps: US rates influence capital flows and the rupee, which in turn influences the RBI’s room to move its own repo rate. That chain is slower and less certain than a direct link.
What is the dot plot and why does it matter more than the rate decision?
The Summary of Economic Projections includes a chart — the dot plot — where each FOMC participant marks where they expect the federal funds rate to sit at each year-end. September is one of four meetings a year that publishes it. On 16 September the median for end-2026 came in at 4.1% against a target range midpoint of 3.875%, and the end-2027 median rose from 3.6% in June to 4.1%. The rate decision tells you what happened; the dot plot tells you what the Committee expects to do next, and that is what capital flows price off.
Why does India’s WPI matter when the RBI targets CPI?
WPI captures input cost pressures at the wholesale level before they reach consumers. A WPI fuel component at 22.93% signals that energy costs are moving through the supply chain now — the consumer price effect follows with a lag, typically two to four months. The RBI watches both, because WPI turns before CPI does.
When is the next RBI rate decision?
The Monetary Policy Committee meets on 5–6 October 2026. The rate decision and statement are announced on 7 October. Watch the MPC statement for: how the committee characterises crude-driven inflation, whether the stance shifts from “neutral,” and any signal on the rate path for the rest of FY 2026-27.
Primary sources
- FOMC meeting calendar — federalreserve.gov: September 15–16, 2026 meeting dates and 2:00 PM ET press conference time confirmed.
- FOMC statement, 16 September 2026 and the accompanying Summary of Economic Projections — federalreserve.gov.
- MoSPI Consumer Price Index, August 2026 (provisional), PIB release 14 September 2026 — CPI 4.82% headline, food 5.95% — mospi.gov.in.
- Office of the Economic Adviser, Wholesale Price Index August 2026 (provisional), 14 September 2026 — WPI 9.92%, Fuel and Power 22.93% — eaindustry.nic.in.
- USD/INR 95.95, 16 September 2026 — rbi.org.in reference rate archive.
- CME FedWatch, hike probability 84.1% as at 14 September 2026 — cmegroup.com/markets/interest-rates/cme-fedwatch-tool.
- US Bureau of Labor Statistics, Consumer Price Index — August 2026, release USDL-26-1496, 11 September 2026 — all items +3.4% over 12 months; all items less food and energy +2.4% (from 2.5% in July); core +0.3% on the month; gasoline +3.9% on the month, over one third of the monthly all-items increase; energy index +16.3% over 12 months.
- Income-tax Rules, conversion of foreign currency for Schedule FA — State Bank of India telegraphic transfer buying rate (TTBR) on the relevant date — incometax.gov.in.
- FOMC Summary of Economic Projections, 16 September 2026 — median federal funds rate 4.1% (2026), 4.1% (2027), 3.9% (2028), 3.2% longer run; unemployment 4.1%, GDP 2.3%, PCE inflation 3.7% for 2026. June comparatives as published.
Secondary sources and commentary
- Kiplinger, “September Fed Meeting: Live Updates and Commentary,” September 2026 — market expectation context.
- TradingKey, “June Fed Decision: Dot Plot Significantly Raised,” 2026 — June SEP: nine members projected further hikes, rate path signalled to ~3.8% by year-end.
- ANI / The Tribune, “Wholesale Price Inflation inches up to 9.92% in August 2026,” 14 September 2026 — WPI breakdown by major groups.
- NSDL data as reported by Business Standard, The Wire and The Federal, 13 September 2026 — FPI outflow of Rs 13,138 crore to 11 September; July and August net inflows of Rs 20,200 crore and Rs 29,631 crore; cumulative 2026 selling Rs 2.37 lakh crore against Rs 1.66 lakh crore in 2025.
- UrbanMoney / BankBazaar, “SBI Home Loan Interest Rate September 2026” — current EBLR-linked home loan rate range (7.25%–8.45%).
- Brent crude $102.81 close on 15 September 2026 and approximately $107.77 on 16 September 2026; month +21.66% to 15 September. Secondary sources. Saudi Yanbu loadings suspended following the East-West pipeline shutdown.
The Bottom Line
The Fed decision does not move your EMI and does not tell you what to do with your portfolio. The India-side story — CPI at 4.82% with food at 5.95%, WPI at 9.92%, crude near $108, FII outflows past Rs 2.37 lakh crore for the year — is already running before today’s announcement adds its input. The dot plot determines more than today’s decision did — a 4.1% median for end-2026 against a 3.875% midpoint points at one further increase before December, with the central tendency allowing two, and the end-2027 median moved half a point in three months. The RBI’s response on 7 October determines what reaches your EMI.
One email when something is published. No daily digest, no tips.
Subscribe freeWhat the RBI does on 7 October
One email when the MPC decides, and what it means for your EMI.
No daily digest, no tips.
Disclosure and method
The specific risk on this page: the two-step Fed-to-EBLR transmission is not a committed mechanism — the RBI makes its own rate decisions on its own schedule, and the relationship between US rates, the rupee, and Indian repo rate decisions is not mechanical. The Editor’s Analysis block reflects the named author’s view; the article body presents both sides of the data tension without adjudicating. All CPI and WPI figures are provisional MoSPI and OEA releases dated 14 September 2026 and may be revised. Brent, FII and exchange-rate figures carry the date they were taken. Nothing here is personalised investment, tax or financial advice — see our full disclaimer. Researched and drafted with AI assistance and reviewed before publication.
Keep reading
This article is part of our RBI and macro guide — the full set of explainers for salaried Indians, in the order you actually meet them.